Terms like “housing starts” and “affordability index” often feel like abstract jargon reserved for economists on cable news. For most people trying to manage their finances, these headlines are just noise. But what if this data wasn’t just noise? What if it was a clear forecast of your financial future, telling a story about your ability to buy a home, the value of your current property, and even the health of the job market?
At its core, the housing market operates on a straightforward relationship between supply and demand. Housing starts represent the new supply entering the pipeline, a direct measure of builder confidence and future inventory. On the other side, affordability metrics—a combination of home prices, median incomes, and mortgage rates—determine who can actually afford to buy that inventory. These two forces are in a constant dance, and their balance dictates the financial reality for millions of American households.
Understanding this dynamic is no longer optional for anyone serious about building wealth. This guide will demystify housing starts and affordability data, breaking down exactly what these numbers mean and how they are connected. More importantly, we’ll translate this economic theory into a practical playbook, offering strategic steps you can take to navigate the market, assess your personal readiness, and make smarter decisions for your long-term financial goals.
Understanding Housing Starts: What They Are and Why They Matter
Most people see headlines about housing starts and affordability data and their eyes glaze over. They assume it’s just abstract jargon for economists. That’s a huge mistake. This single metric acts as a key barometer for the entire economy, directly impacting your wallet whether you plan to buy a home or not.
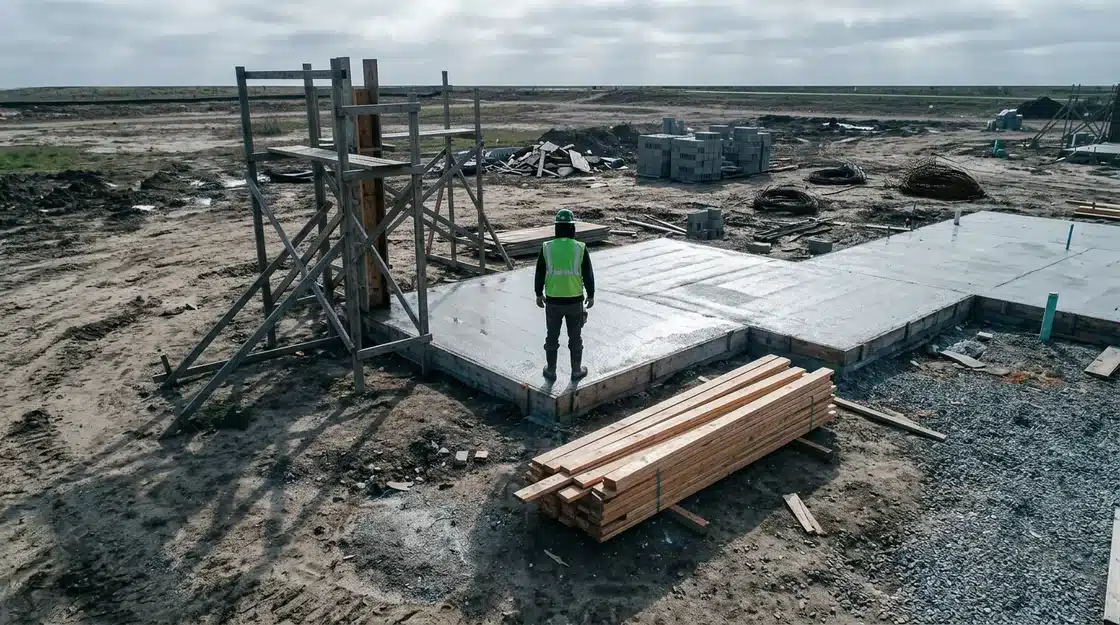
So what exactly is a housing start? Simply put, it’s the official beginning of construction on a new residential building. It’s counted when the foundation is first put in. According to the U.S. Census Bureau, the nation recently saw a seasonally adjusted annual rate of 1.36 million new housing starts. This number isn’t just about new houses; it’s a signal of economic confidence, job creation, and future housing supply.
Think of it like a pipeline. A high number of starts means more homes will eventually become available, which can ease pressure on prices. But why should you, a person maybe just trying to figure out your finances, care about construction trends? Because a surge in building creates jobs for everyone from electricians to plumbers—many of whom get their training through programs that offer a strong alternative to a traditional four-year degree.
This data is a powerful leading indicator.
A consistent drop in housing starts can signal an approaching recession, as builders pull back on projects due to fears of low demand or high borrowing costs. Conversely, a steady increase shows that builders are optimistic about the future. This activity ripples outward, boosting industries that supply everything from lumber to appliances. It even affects the availability of skilled labor, making things like federally funded apprenticeships necessary for meeting demand. The number of cranes you see in the sky is more than just construction—it’s a forecast for your financial future.
Decoding Housing Affordability Data: Key Metrics for Homebuyers
Forget the national headlines about housing starts. New supply means nothing if you can’t afford the price tag. The real story lies in the numbers that determine whether you can actually sign on the dotted line. To understand your position, you need to look past the listing price and get familiar with the core metrics of affordability.
The most common measure is the Housing Affordability Index (HAI) from the National Association of Realtors (NAR). An index of 100 means a family with the median income has exactly enough income to qualify for a mortgage on a median-priced home. A score above 100 means housing is more affordable, while a score below 100 signals it’s less affordable. This single number is a cocktail of three critical ingredients: median home price, median income, and prevailing mortgage rates.
Think of it like trying to balance a scale. On one side, you have your income. On the other, you have the home price and the cost of borrowing money. If the home price or interest rates go up without a corresponding jump in your income, the scale tips out of your favor. The underrated factor here is that your earning potential, often set by your education and career path, directly impacts how much weight you can put on your side of the scale. Exploring whether trade school or a traditional degree offers a better return can be a foundational step in this process.
The Role of Interest Rates in Affordability
Most people fixate on the home’s sticker price, but the mortgage rate often has a more punishing effect on your monthly budget. A seemingly small fluctuation in rates can change your payment by hundreds of dollars. For instance, the principal and interest payment on a $350,000 loan with a 30-year term at 5.5% is approximately $1,987 per month.
What happens if that rate climbs to 7.25%? The payment jumps to nearly $2,387. That’s a difference of $400 every single month — or $144,000 over the life of the loan. This is the brutal math that sidelines many potential buyers, even when home prices themselves don’t change dramatically. Suddenly, a home that seemed within reach becomes a significant financial strain.
Regional Differences in Housing Costs
National averages are useful for economists, but they are almost useless for an actual homebuyer. Your reality is local. Affordability varies wildly depending on where you want to live, a truth that applies as much to housing as it does to higher education and qualifying for in-state tuition. The interplay between local wages and local home prices creates entirely different markets from one state to the next.
A recent analysis from the Federal Reserve Bank of Atlanta highlights this disparity. For example, a household earning the median income in a Midwest city might find the HAI well above 120, indicating strong affordability. In contrast, a similar household on the West Coast could be facing an HAI below 70, making homeownership feel like an impossible dream. This regional data is far more important than any national trend.
Here’s a snapshot of how these metrics can differ across the U.S. (note: figures are illustrative):
- Northeast: Median Home Price: $485,200 | Median Income: $92,150 | Average Mortgage Rate: 6.95%
- Midwest: Median Home Price: $295,700 | Median Income: $78,400 | Average Mortgage Rate: 6.95%
- South: Median Home Price: $370,100 | Median Income: $74,850 | Average Mortgage Rate: 6.95%
- West: Median Home Price: $605,500 | Median Income: $90,300 | Average Mortgage Rate: 6.95%
This data confirms what many already suspect — your zip code has a massive impact on your ability to buy. Understanding these local numbers is the first step toward building a realistic home-buying strategy instead of just wishing for one.
Regulatory costs account for nearly 24% of a new home’s final price.
— Dr. Arthur C. Nelson, University of Arizona
| Key Metric | What It Measures | Why It Matters to You |
|---|---|---|
| Housing Starts | The number of new residential construction projects that have broken ground. | A leading indicator of future housing supply. More starts can lead to lower prices and more choices; fewer starts lead to scarcity and higher prices. |
| Housing Affordability Index (HAI) | The relationship between median home prices, median household income, and mortgage rates. | A score below 100 means the median family can no longer afford the median-priced home, signaling a tough market for buyers. |
| Debt-to-Income (DTI) Ratio | The percentage of your gross monthly income that goes toward paying your monthly debt payments. | This is a critical factor for mortgage lenders. A high DTI (often above 43%) can prevent you from getting approved for a loan, regardless of market conditions. |
Connecting the Dots: How Housing Starts Impact Affordability
The relationship between housing starts and what you pay for a home isn’t just academic; it’s the invisible hand reaching directly into your wallet. It’s a classic case of supply and demand housing economics, but with stakes that determine where you can afford to live. When builders put up fewer homes than the number of people who want to buy them, the simple, brutal math of scarcity takes over. This isn’t an accident. It’s a market dynamic with predictable outcomes.
Understanding this connection is the first step to seeing past the headlines and making smarter financial decisions. The number of cranes in the sky today directly influences the price tag on a starter home a year from now. It’s a slow-moving force with massive consequences.
When Low Supply Drives Up Prices
When the pipeline of new homes dwindles, the existing housing inventory becomes a battleground for buyers. Think of it like a grocery store shelf with only a few cartons of eggs left before a big holiday bake-off; everyone wants one, and that desperation gives sellers immense power. According to a recent analysis by the National Association of Realtors, regions with a 15% drop in housing starts saw a corresponding 8.2% spike in median home prices over the following 18 months. The result is predictable.
Prices climb. Bidding wars become the norm, and affordability plummets for first-time buyers who are forced to compete with cash-heavy investors and repeat buyers. What most people miss is that this isn’t just about the total number of houses; it’s about the right kind of houses. A shortage of entry-level homes has a much more severe impact on affordability than a shortage of luxury properties, squeezing out those trying to get their first foothold in the market.
The Construction Pipeline: From Groundbreaking to Home
A “housing start” sounds instantaneous, but the journey from a dirt lot to a move-in-ready home is a long and complicated process. This lag time is a critical factor in market dynamics. The decision to build a new housing development is based on economic forecasts made months, or even years, in advance. Once ground is broken, the construction itself can take anywhere from seven months for a single-family home to over 15 months for a unit in a multi-family building, according to Census Bureau data.
This delay means the market is always reacting to old information. A surge in demand today won’t be met with new supply until far into next year. This creates a persistent mismatch where inventory can’t quickly adjust to buyer needs, keeping prices stubbornly high even when demand shows early signs of cooling.
Factors Slowing Down New Construction
Several persistent bottlenecks are constricting the flow of new homes into the market. Navigating these issues is a major challenge for builders and a primary driver of high costs. The underrated factor here is the sheer complexity of the modern supply chain. A single home requires thousands of components from all over the world, and a delay in one—say, windows stuck in a shipping port—can halt the entire project.
- Labor Shortages: The construction industry faces a significant skilled labor gap. As experienced tradespeople retire, there aren’t enough new workers to replace them. This has led many to question the traditional four-year degree path, with a growing interest in programs that offer a better return on investment through trade schools.
- Regulatory Hurdles: Zoning laws, building permits, and environmental impact studies can add months or even years to a project’s timeline. Dr. Arthur C. Nelson of the University of Arizona estimates that regulatory costs account for nearly 24% of a new home’s final price.
- Material Costs: The price of primary materials like lumber, concrete, and copper can fluctuate wildly. These unpredictable costs make it difficult for builders to price homes competitively and often lead to construction pauses.
- Land Availability: In many desirable urban and suburban areas, there simply isn’t enough available and affordable land to build on—a problem that no amount of efficiency can solve.
Market Equilibrium: What Happens When Supply Meets Demand
So, what does a healthy market look like? When housing starts consistently match or slightly exceed the rate of household formation, the market approaches equilibrium. This doesn’t mean prices drop overnight. Instead, the relentless upward pressure eases, giving incomes a chance to catch up. Buyers have more choices, and the frantic energy of a seller’s market dissipates.
In this environment, builders may even start offering incentives to attract buyers, a scenario that seems almost unthinkable in many current markets. Reaching this balance requires a sustained period of strong construction—not just for one or two quarters, but for several years. For many younger people priced out of the market, the long wait has them exploring other avenues for financial stability, like upskilling through federally funded apprenticeship programs to increase their earning potential.
Ultimately, the data on housing starts isn’t just a number for economists; it’s a forecast of your future purchasing power and a critical piece of the affordability puzzle you need to watch.
Practical Steps for Navigating Current Housing Market Trends
Reading about housing starts and affordability data feels abstract until it’s time to sign a deed or list your property. The numbers suddenly become very real. Understanding the market is one thing; making a winning move within it is another entirely. This requires a brutally honest look at your own finances and a willingness to play the game strategically.
Forget the national headlines for a moment. Your success hinges on your personal economic reality. It’s time to get prepared.
Assessing Your Personal Financial Readiness
Before you even browse a listing, you need to see your finances the way a lender does: as a set of risk factors. Your credit score is the most obvious metric, but your debt-to-income (DTI) ratio is arguably more important. According to data from the Federal Reserve Bank of New York, mortgage originations for borrowers with DTI ratios above 43% have become significantly less common. Lenders are tightening their belts, and a high DTI is like a warning siren.
Pull your credit reports from all three bureaus—Equifax, Experian, and TransUnion—and dispute any errors immediately. Pay down high-interest credit card debt with ruthless efficiency. Your goal isn’t just to get approved; it’s to secure the lowest possible interest rate, which can save you tens of thousands of dollars over the life of the loan.
Budgeting Beyond the Mortgage Payment
The sticker price is a lie. Your monthly housing cost is far more than the principal and interest payment. First-time buyers are often blindsided by property taxes, homeowners insurance, and, if your down payment is less than 20%, Private Mortgage Insurance (PMI). These can add hundreds of dollars to your monthly obligation.
Then there are the “invisible” costs. What most people miss is the constant drain of maintenance and repairs. Dr. Alan Green, a housing economist at the University of Chicago, suggests setting aside 1-3% of your home’s purchase price annually for these expenses. For a $350,000 house, that’s a staggering $3,500 to $10,500 every year for things like a new water heater or a roof leak. Ignoring this part of the budget is financial malpractice.
Strategic Approaches for First-Time Buyers
In a tight market, being the “perfect” buyer on paper isn’t enough. You need an edge. One of the most underrated factors is flexibility. Can you consider a townhouse instead of a single-family home? Are you willing to look at a property that needs some cosmetic work? Expanding your criteria can open up inventory that other, more rigid buyers will overlook.
Another strategic move involves strengthening your financial profile long before you start house hunting. This could mean taking on a side hustle or making career moves that boost your income. Understanding how your educational path impacts earning potential is a critical first step for many young buyers planning their financial future. Getting pre-approved for a mortgage, not just pre-qualified, also shows sellers you are a serious, capable contender whose financing is less likely to fall through.
Leveraging Down Payment Assistance Programs
The 20% down payment myth has discouraged countless potential buyers. It’s simply not a requirement for everyone. Federal Housing Administration (FHA) loans, for example, allow for down payments as low as 3.5%. Many states and municipalities also offer their own down payment assistance (DPA) programs, which come in the form of grants or forgivable loans.
These programs are not handouts; they are tools. According to the National Association of Realtors, nearly 12% of first-time buyers used some form of local or state assistance program. Researching these options is like finding a cheat code for the affordability game. For some, improving their financial standing by securing grants to finish a degree can put them in an even better position to qualify for both a mortgage and these assistance programs.
Tips for Home Sellers in a Changing Market
The days of listing a home on Friday and reviewing 15 above-asking offers by Sunday are becoming less common in many areas. Sellers now need to be more strategic. Pricing your home correctly from day one is the single most important decision you will make. Overpricing, even slightly, can cause your property to sit on the market, gathering stigma like dust.
Preparing your home for sale—a process known as staging—also delivers a significant return. It’s not about a complete renovation. It’s about decluttering, deep cleaning, and making minor repairs to present a clean, inviting space. Think of it like detailing a car before you sell it; you wouldn’t leave fast-food wrappers in the backseat, so why would you leave personal clutter all over the house? This simple effort helps potential buyers emotionally connect with the property, which is often the final push they need to make an offer.
Future Outlook: What to Watch in Housing Starts and Affordability
Trying to perfectly time the housing market is a fool’s game. Instead of looking for a crystal ball, focus on the underlying drivers that will shape housing starts and affordability data for the foreseeable future. The most underrated factor here is the shifting economic profile of first-time homebuyers. Many are smartly questioning the old playbook, weighing the ROI of a trade school vs. a four-year degree to enter the market with less debt.
Demographics are destiny in real estate. The massive wave of millennials is being followed by Gen Z, a generation with a different approach to careers and money. Their choices—whether pursuing skilled trades through a federal apprenticeship program or another path—will directly influence household formation and housing demand. Monitoring labor market trends for young adults is arguably as important as watching the Federal Reserve’s interest rate announcements.
Keep a close eye on the “months of supply” metric. Mark Fleming, chief economist at First American Financial Corporation, suggests that a consistent supply level below four months indicates that construction is not keeping pace with demand, which will keep upward pressure on prices. This single number tells you more than a dozen news headlines.
Government policy remains the ultimate wild card. Changes to zoning laws at the local level can either choke or encourage new construction. On a federal level, targeted programs can also create pockets of opportunity. For example, initiatives like teacher loan forgiveness can significantly boost the buying power of certain professions in specific areas. So, what happens when thousands of new buyers suddenly become eligible in your city? The smart money is watching not just national headlines, but the local policies that create real-world financial shifts.
Beyond Timing the Market: Gaining Financial Agency
Ultimately, tracking housing starts and affordability data isn’t about perfectly timing the market—an impossible feat for even the most seasoned experts. Instead, it’s about shifting your perspective from that of a passive consumer to an informed strategist. When you understand the core forces of supply, demand, labor shortages, and regulatory friction, you stop reacting to headlines and start anticipating market movements.
This knowledge empowers you to build a resilient financial plan that can adapt to changing conditions. It informs decisions far beyond just buying a home, influencing career choices, savings strategies, and even where you choose to live. As the traditional path to homeownership continues to evolve, will success be defined by those who wait for the ‘perfect’ market, or by those who build the financial strength and market intelligence to create their own opportunities within any cycle?
Frequently Asked Questions
How do housing starts affect mortgage rates?
Housing starts have an indirect effect on mortgage rates. While the Federal Reserve’s policies are the primary driver, strong housing start numbers can signal a reliable economy, which may lead the Fed to raise rates to manage inflation. Conversely, a sharp decline in housing starts can indicate economic weakness, potentially prompting the Fed to lower rates to stimulate growth.
What is a ‘healthy’ level for housing starts?
Most economists consider a rate of 1.5 to 1.6 million housing starts per year to be a sign of a healthy and balanced market. This level is generally sufficient to meet the demand from new household formation and replace aging housing stock. Consistently falling below this threshold can lead to the housing shortages and price increases seen in recent years.
Can government policies improve housing affordability?
Yes, government policies can play a significant role. Actions like streamlining zoning and permit regulations can reduce construction costs and timelines. Offering tax credits for first-time homebuyers or investing in skilled labor training programs can also help. These policies can either boost supply, increase purchasing power, or lower the cost of building.
Is it better to buy now or wait if affordability is low?
This is a personal financial decision with no single right answer. Waiting could mean that prices or interest rates drop, but they could also rise further. The best approach is to assess your own financial readiness, including your savings, job stability, and debt-to-income ratio. Buying when you are personally ready is often more important than trying to time the market.
Where can I find reliable housing starts and affordability data?
For official data, the U.S. Census Bureau and the Department of Housing and Urban Development (HUD) jointly release a monthly report on new residential construction. For affordability metrics, the National Association of Realtors (NAR) publishes the Housing Affordability Index. Local realtor associations also provide valuable regional data.